

Social Proof Plugin Performance Benchmarks
in the last few years we've observed dozens of competitors, most of them IP-infringing clones, enter the market with inferior products.
not everyone needs all the features we offer, so i don't blame anyone for trying and loving other tools. sometimes you just want McDonald's.
but there is a degree of objectivity in snippet-based web technology, and it's measured by code efficiency and performance.
this week we clocked Fomo vs a few random competitors to learn how we fare.
methodology
every experiment needs a Control.
our VP of engineering, Chris Bacon, spun up a vanilla landing page to first collect benchmark metrics for page size, page speed, HTTP requests, and average load time.
benchmarks:
- 1.5kb page size
- 100 speed (Google / Pingdom)
- 248.33ms average load time
- 2 network requests
because web servers can be unpredictable in their response times, we decided to run 3 "trials" per Fomo competitor and report the average.
on our blank Control page, for example, individual load times were 191ms, 357ms, and 197ms. very different indeed!
experiment
we analyzed Fomo and 5 competitors for snippet size (in kilobytes), average snippet load time (milliseconds), and number of network requests.
metrics were collected with Google Page Speed Insights and Pingdom.
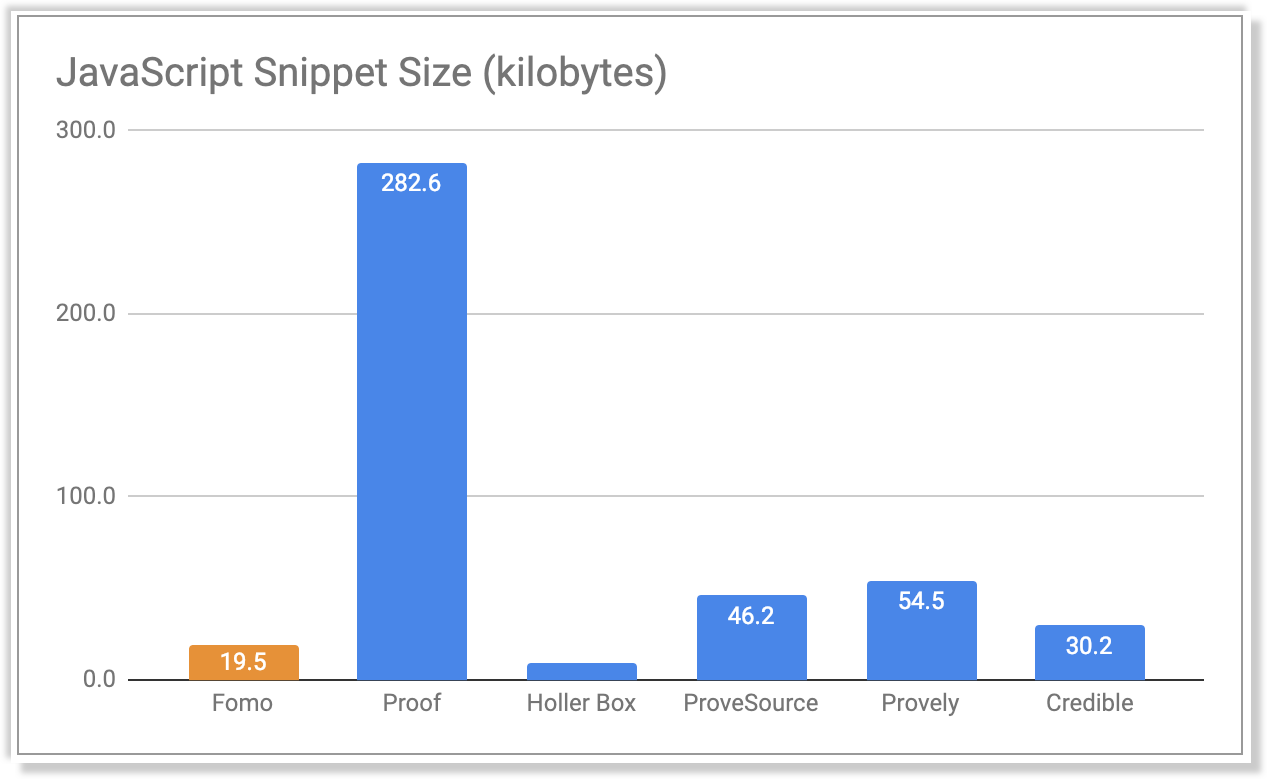
snippet size
while Fomo is quite small at 19.5kb, competitor Holler Box beat us at 9.4kb.
they also had to change their homepage after ripping off our copywriting, so we'll take the extra 10kb and 2nd place status.
to learn how we achieved such a small snippet, read our engineering post here.
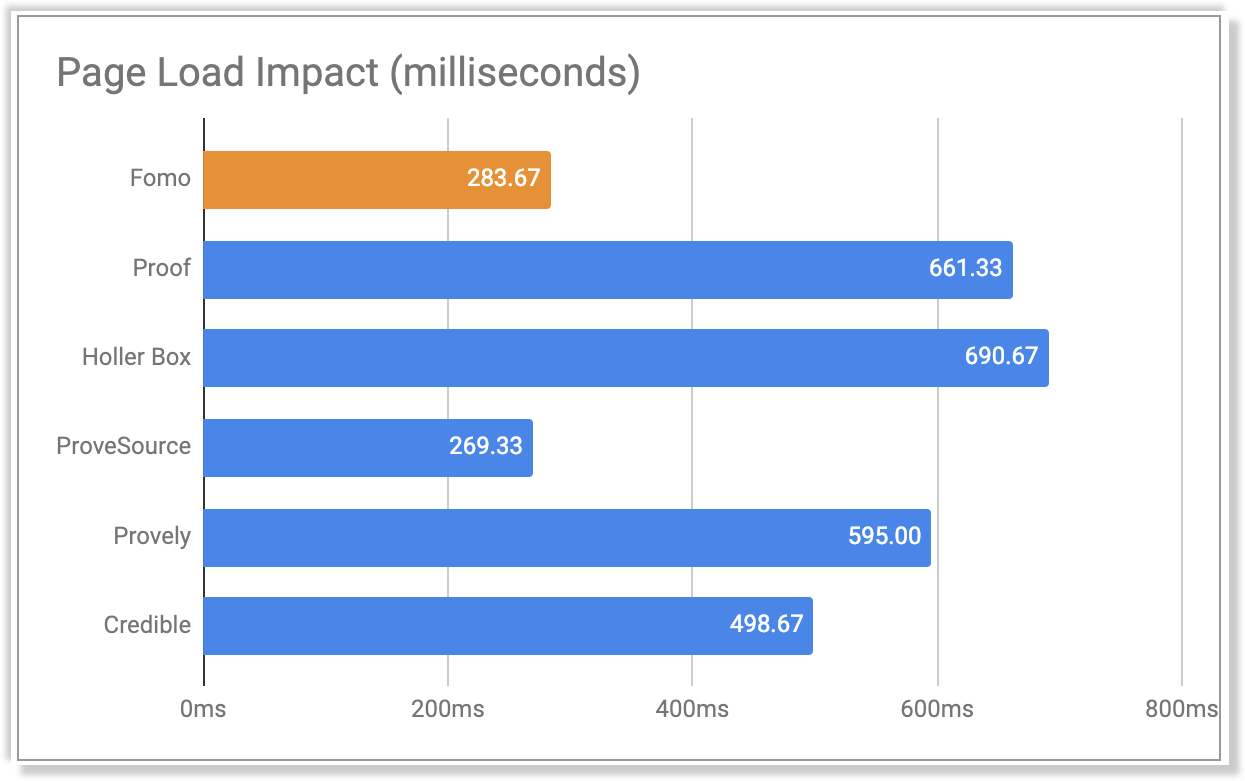
snippet load time
this is perhaps the most important metric. all snippets in this experiment load asynchronously, which means the end-user experience isn't "halted" (forced to wait) while the content finishes loading.
that said, social proof is just 1 element on the average web page.
for sites with live chat, external fonts, event tracking, and other common tools embedded, 20-100 inefficient milliseconds per solution quickly adds up to a full second, which is noticeable on mobile devices not connected to WiFi.
upon learning Fomo is again 2nd place, we discussed internally if it's worth reducing further to "sub-ProveSource" levels.
ultimately we decided no. while ProveSource loads slightly faster, they also lack our load-intensive features like geo-targeting, so the comparison is somewhat apples <> oranges. in any case, congrats to them (seriously).
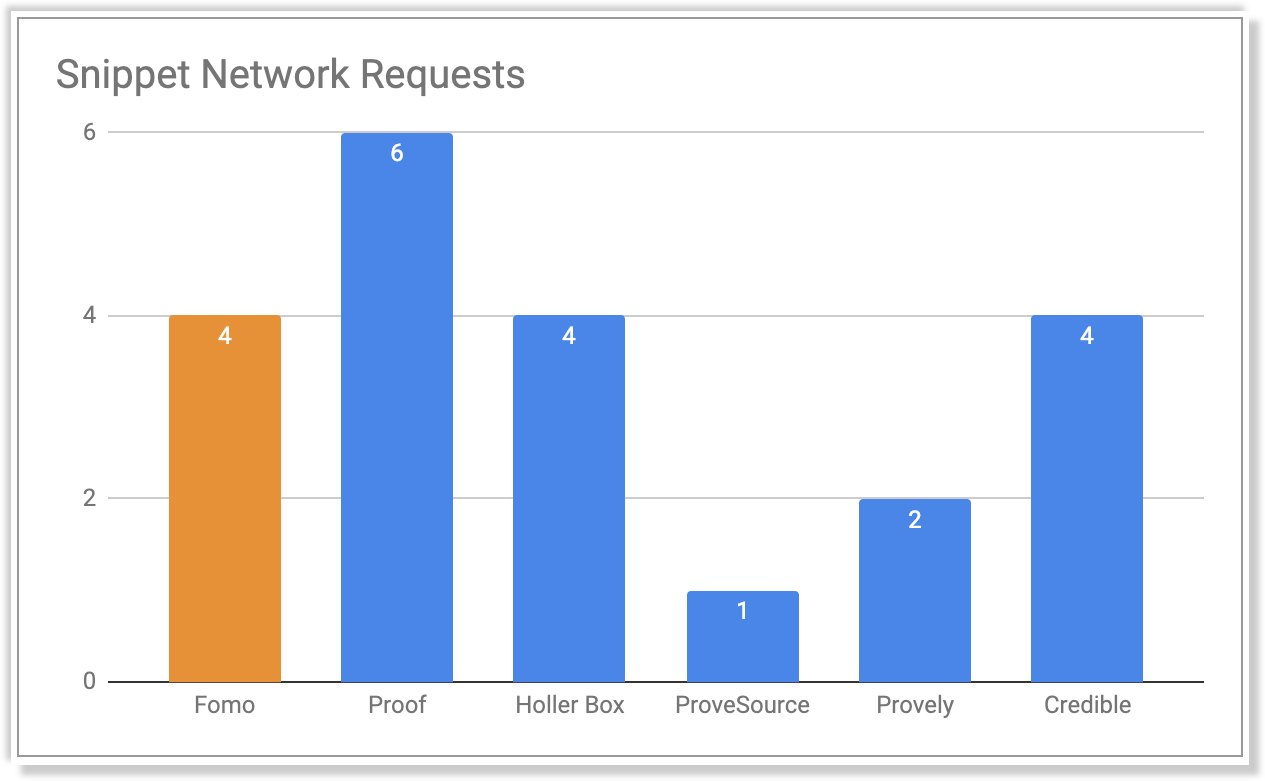
network requests
this metric is a nice balance of "robustness" vs "efficiency."
for example, the Fomo snippet makes 4 requests to understand Page Rule settings, track stats, and translate notifications to the browser's preferred language:
- initial code fetch (script tag fetches vanilla JavaScript)
- geocoding (pings geocode.fomo.com to determine visitor location)
- pageviews (upticks a 'view' for given page path or entire domain)
- events (code from #1 makes async request for array of notifications)
each of these requests serves a purpose, however snippets that make requests merely to require libraries like jQuery do not improve the end-user experience through additional roundtrips.
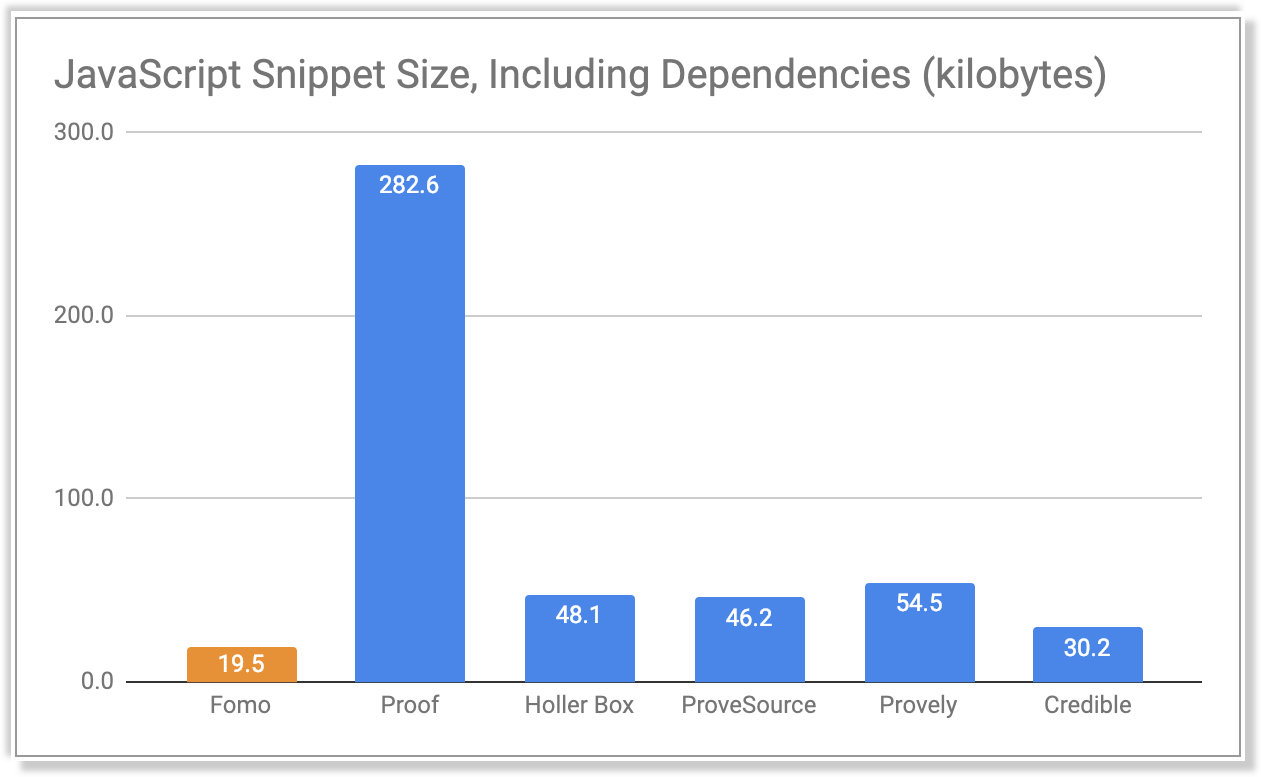
data normalization
in checking out the snippets of Fomo and 5 competitors we learned 2 of them require jQuery, a popular but large (29-38kb+) JavaScript helper library.
Fomo competitors requiring jQuery:
- Holler Box
- Provely
returning to our first test, Snippet Size, we now know websites using Holler Box which do not already have jQuery installed will suffer another 38.7 kilobytes in loaded page elements (total 48.1kb) in order for Holler Box to function.
this means Fomo ranks 1st place in snippet size among the 6 tested products.
this finding applies to our Network Requests analysis too.
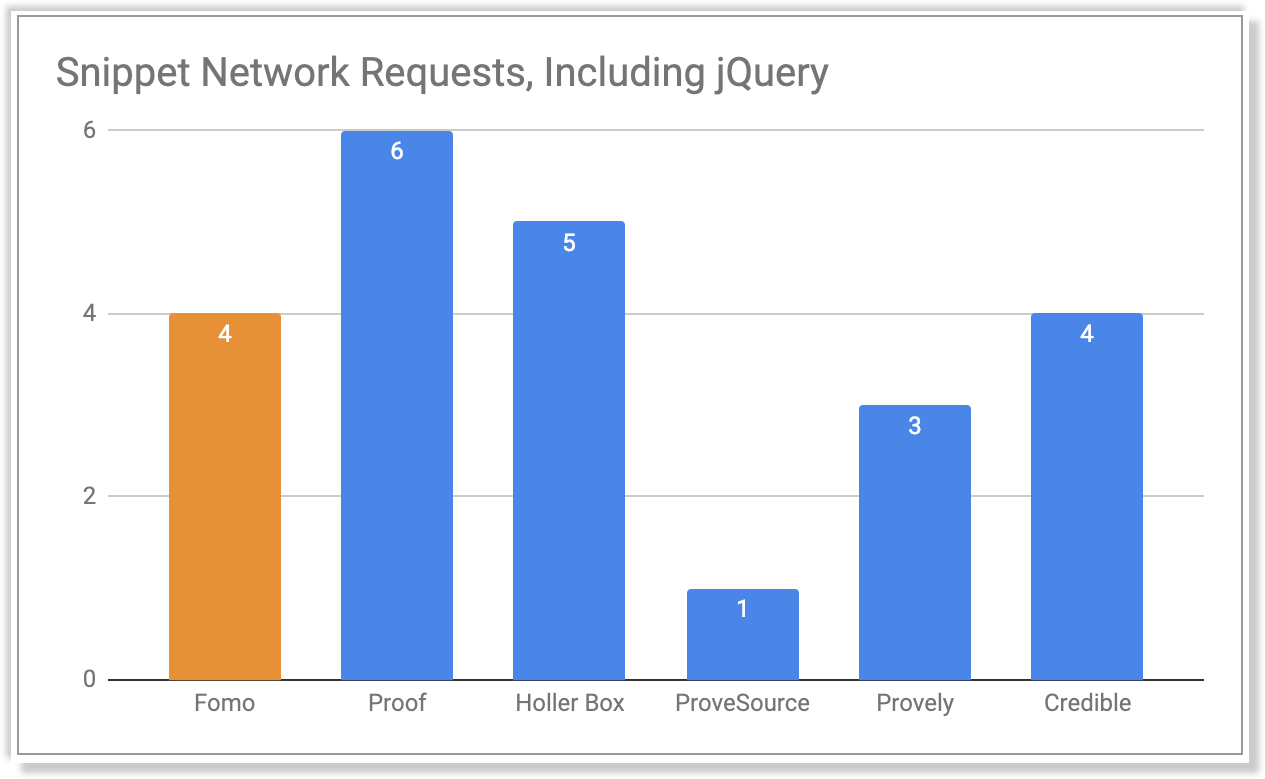
since Holler Box and Provely require jQuery, some of their clients' websites make 1 additional HTTP request before the tool operates, putting their tallies at 5 and 3 respectively.
finally, it's worth mentioning no 2 Fomo snippets are the same; our "pageviews" and "geotargeting" features are modular, thus not included unless they're being used.
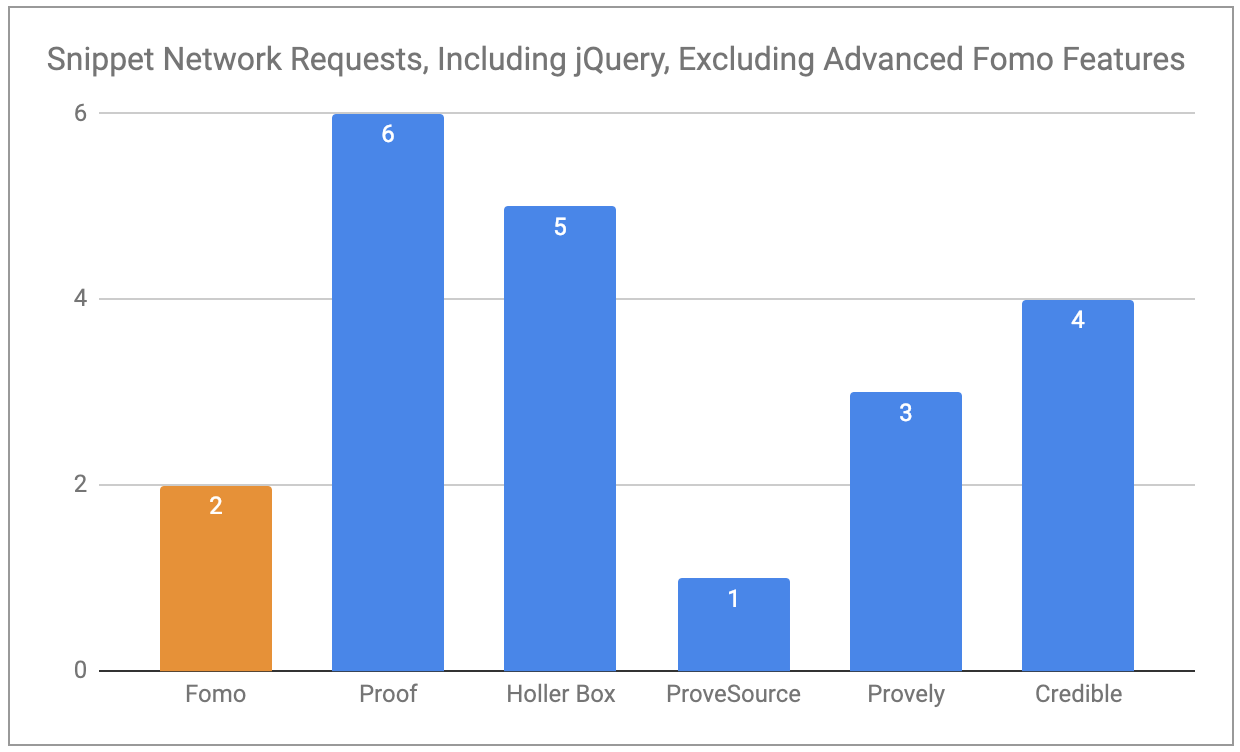
with these features disabled our network requests reduce from 4 to 2, eliminating requests #2 and #3 from the 4 steps outline steps above.
(as of February 2019 only 613 websites, or ~11% of our base, use the pageviews feature, and 506 use geo-targeting).
summary
for embeddable social proof tools, features are only half the battle.
the other and perhaps more important technical challenge is measured by impact to end-users on customer websites. after all, speed == conversions.
the next time you calculate performance metrics for widget-type software, consider snippet size, page speed, and number of network requests in your evaluation.